BODYGRAM® DASHBOARD 3.0
The updated software for more specific and accurate body composition analyses.
Bodygram 3.0 is the latest version of the BODYGRAM® Dashboard software, now more comprehensive as user can select from 3 different analysis configurations the one which best suits the subject under analysis. In fact, for more accurate and reliable results, it is possible to select the most suitable configuration for each subject measured, optimizing the analysis based on the subject’s profile and objectives.
BODYGRAM® Dashboard 3.0 AKERN® incorporates AKERN®’s scientific progress and knowledge in body composition making it available to professionals.
BODYGRAM® DASHBOARD 3.0: customize your analysis with the Bodygram® configurations
Each configuration represents a harmonized set of equations, references and graphs that consistently describe the quantitative and qualitative changes in the body composition of each subject.
For this purpose, each of the 3 configurations has a specific Biavector®, a set of equations, validated and published reference values.
-

BODYGRAM STANDARD
Bodygram® Standard is the “historical” Bodygram® configuration, and it includes equations that have been used for more than 30 years and refer to an estimation model based on the hydration status of the subject. This configuration finds it’s best application on clinical subjects where high sensitivity to changes in body fluids is required. In addition to the known Biavector® from Piccoli (1995), this configuration features AKERN®‘s proprietary equations, known to be sensitive to small changes in impedance.
Given the extensive experience in the application of this combination of Biavector® and equations, validated and utilized for over 20 years also on hospitalized subjects, this configuration is most suitable for these subjects, individuals with more than one co-morbidity, elderly subjects over 75 years of age, subjects with BMI > 40 or BMI < 17 and children/adolescents under 16 years of age.
-
WEIGHT CONTROL
Weight Control is recommended for healthy adult subjects (>16 years of age), following a weight management program or a body recomposition protocol, with 17<BMI<4, who have no known pathological conditions.
The Weight Control Biavector® encloses ellipses published in 2023, that are more descriptive of the current population. The equations and reference values are validated and updated for the specific study population targeting weight management, body recomposition and general well-being.
In Weight Control new equations have been introduced for more accurate and precise estimations of FFM (Fat Free Mass), TBW (Total Body Water), ECW (Extracellular Water), BCM (Body Cell Mass) and BMR (Basal Metabolic Rate).
-
SPORT & ACTIVITY
Sport & Activity is the configuration dedicated to athletes. The Sport & Activity Biavector® features recently published and descriptive ellipses of the élite sport population. The equations and reference values are validated and specific for athletes.
With Sport & Activity configuration, the assessment of the fat free mass of athletes is more accurate and specific due to the LST parameter (Lean Soft Tissue – a-LST & l-LST). Monitoring this parameter in a sports – person allows to optimize performance, monitor response to training and assess/prevent the risk of injuries.
Moreover, the new equations for FFM (Fat Free Mass), TBW (Total Body Water), ECW (Extracellular Water) and BMR (Basal Metabolic Rate) have been validated on sports-population.
This configuration is recommended for subjects practicing vigorous and intense sport activity for a total of more than 8-10 hours per week or with PAL>2, in élite or professional athletes whose goal is to maximize their performance.


AKERN® KNOW HOW
-
Algorithms based on the profile of the subject: customized solutions based on professional’s need to better monitor the nutritional state and hydration of the subject.
-
Direct qualitative analysis of tissues through the BIVA approach and the Biavector® nomogram, descriptive of the given population.
-
Predictive equations and specific reference values for paediatric, adult, obese, geriatric and sport populations.


Main Functions
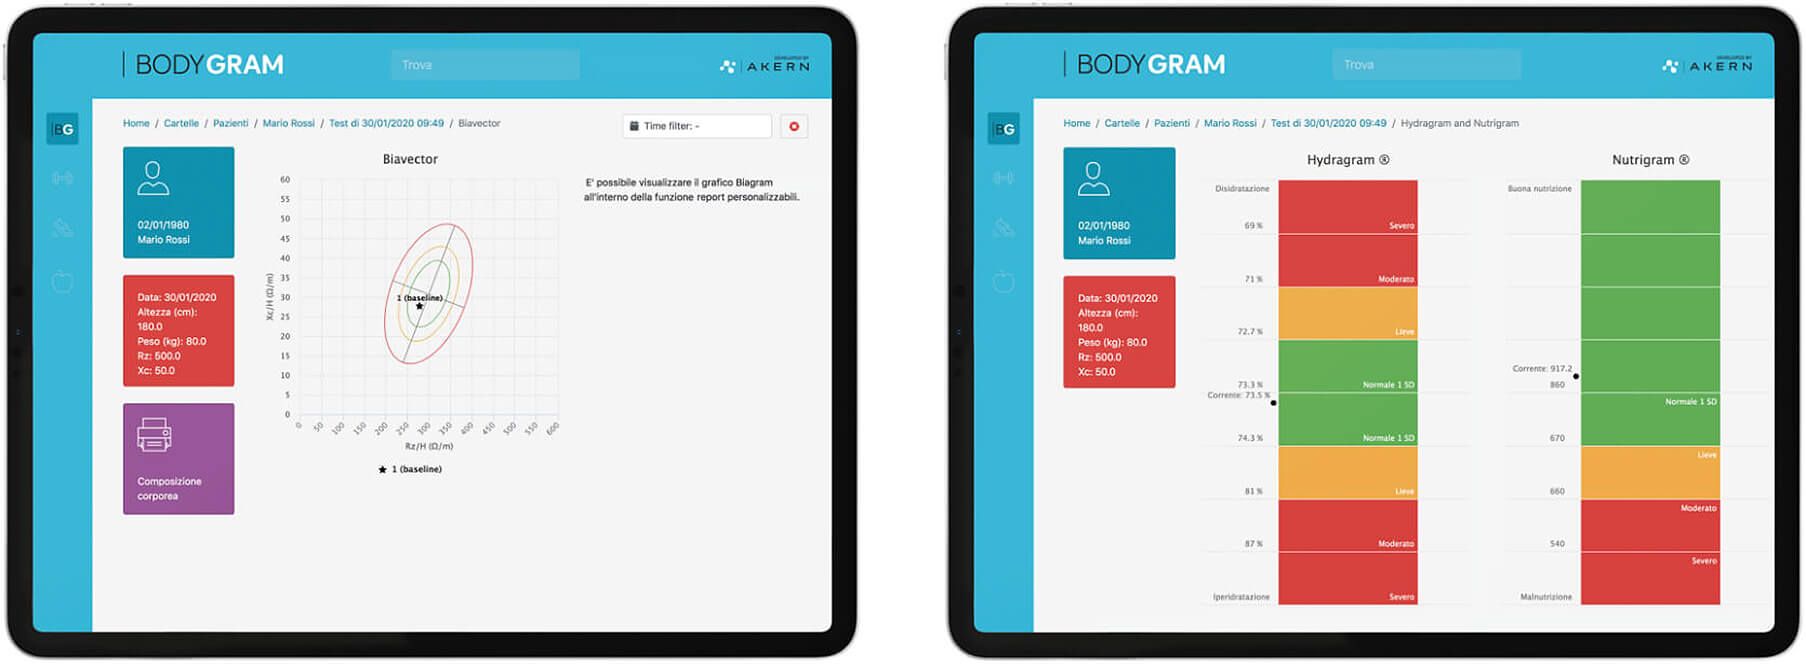

BIAVECTOR® nomogram
By introducing the Biavector® nomogram in 1994, AKERN® has been the first company to implement the Bioelectrical Impedance Vector Analysis (BIVA) within a body composition software. The Biavector® offers a directs interpretation of the hydration and nutritional status.
Being based only on tissue electrical properties, body mass and volume assessments are not influenced by errors derived from predictive equations. Impedance data interpretation further evolved with the introduction of Hydragram® and Nutrigram® scales.

THE HYDRAGRAM® SCALE: TISSUE HYDRATION BY A NUMBER
Hydragram® provides the true subject hydration by giving fluids percentage within the fat free mass. Percentage values correlate with the impedance vector position on the Biavector® nomogram and follow the displacement along the major axis.
Hydragram® classifies subjects as Normohydrated, Hyperhydrated or Dehydrated according to the Moore et al. 1 classification. Subjects with altered hydration can be further stratified according to the degree of fluid alteration (mild, moderate or severe). The use of the Hydragram® scale for hydration also in clinical setting in association with other specific biomarkers as BNP, ProBNP, nGAL3 2,3,4.

THE NUTRIGRAM® SCALE: A CLINICALLY VALIDATED PARAMETER FOR NUTRITIONAL STATUS ASSESSMENT
Nutrigram® provides an estimate of creatine excretion (Ucr/24h) obtained from BCM values. Creatinine is an indirect product of muscle cells totally excreted by the kidney.
The amount of creatinine detected in the 24h is used as a parameter to define the subjects’ cellular mass.
Nutrigram® values correlate with the position of the vector on the Biavector® nomogram and follow the displacement along the minor axis. This parameter was recently validated and is particularly helpful for the management of patients at high risk of malnutrition who require continue nutritional support5.
INDICES FOR SCREENING AND DIAGNOSIS OF MALNUTRITION AND SARCOPENIA ASSESSMENT
Fat-Free Mass Index (FFMI) and Fat Mass Index (FMI) BODYGRAM® software can monitor the nutritional status over time through the use of FFMI and FMI percentile curves for Caucasian subjects from 18 to 98 years old.
Appendicular Skeletal Muscle Index (ASMI): this index represents the ratio between Appendicular Skeletal Muscle Mass (ASMM) calculated using Sergi’s equation (Sergi et al) and height 2(6.7). ASMI has been formally recognized by the latest European guidelines for diagnosis of Sarcopenia (EWGSOP 2).
Muscle Quality Index (MQI): this index in a measure of muscle mass quality and depends on muscle strength measured dynamometry and the amount of estimated muscle mass.
Standardized Phase Angle (SPA): the phase angle standardized by sex and age. This parameter expresses within the population of normal subjects, the ratio between average Phase Angle values of subjects belonging to a specific age and sex group and its standard deviation.
ANTHROPOMETRIC EVALUATION OF BODY CONSTITUTION AND CARDIO-METABOLIC RISK
The anthropometric data that is collected is particularly important to monitor localized fat and to assess the risk of cardio-metabolic diseases. The software provides a simple method for anthropometric data collection and evaluation.
ANALYTICAL EVALUATION OF ENERGY EXPENDITURE
Integrates the calculation of daily energy expenditure with the level of physical activity (PAL) and the energy expenditure induced by physical and sports activities. Based on this data, the user can set a clear weight loss program, based on an accurate estimate of the energy requirement, adjust the calorie intake in the diet, plan the timing of the amount of weight to lose.
ASSESSMENT OF LEAN SOFT TISSUE (LST) DISTRIBUTION TO OPTIMISE SPORTS PERFORMANCE
The Sport & Activity configuration of Bodygram® Dashboard 3.0 uses the LST (Lean Soft Tissue) parameter, which is representative of lean tissue without bone. Therefore, this parameter allows to evaluate the distribution of lean soft tissue especially in the arms (a-LST) and legs (l-LST).
The analysis and monitoring of this parameter in athletes is particularly useful for optimising sport performance, monitoring response to training and assessing injury risk.
Main characteristics
The Bodygram® Dashboardsoftware offers even more advanced performance to make all the knowledge and progress of AKERN® available to the user.
-
Unlimited access to exams anywhere
BODYGRAM® is accessible from any type of device and compatible with the most popular OS: MacOS, iOS, Windows, Android on desktop, smartphone or tablet.
-
Online and offline workspaces
BODYGRAM® offers two different workspaces: Online on a dedicated server platform and Offline with Desktop application (for Windows and MacOS).
-
Automatic database import
Migration to BODYGRAM® platform does not result in data loss. Your database will be imported automatically at you first log in.
-
Periodical scientific update
BODYGRAM® is constantly up to date to guarantee a professional analysis tool always aligned with the clinical research progress.
-
GDPR compliance
BODYGRAM® Patient data management is in accordance with the GDPR (EU regulation 2016/679).
-
Customized reports
BODYGRAM® includes a tool to create customized reports to address different patient management needs. Total freedom in choosing report elements to better guide the patient along his path.
-
Back-up and data storage
BODYGRAM® includes an automatic Cloud based data back-up system and a data recovery function.
-
CE Medical Device
BODYGRAM® is CE marked Class I Medical Software.


Bibliographical references:
- Sardinha, Luís B., et al. "Development and validation of BIA prediction equations of upper and lower limb lean soft tissue in athletes." European Journal of Clinical Nutrition 74.12 (2020): 1646-1652.
- Cappellari, Gianluca Gortan, et al. "Sarcopenic obesity in free-living older adults detected by the ESPEN-EASO consensus diagnostic algorithm: validation in an Italian cohort and predictive value of insulin resistance and altered plasma ghrelin profile." Metabolism 145 (2023): 155595.
- Sandini, Marta, et al. "Predicting the Risk of Morbidity by GLIM-Based Nutritional Assessment and Body Composition Analysis in Oncologic Abdominal Surgery in the Context of Enhanced Recovery Programs: The PHase Angle Value in Abdominal Surgery (PHAVAS) Study." Annals of Surgical Oncology (2024): 1-10.
- Van Dessel, Kristof, et al. "Basal metabolic rate using indirect calorimetry among individuals living with overweight or obesity: The accuracy of predictive equations for basal metabolic rate." Clinical Nutrition ESPEN 59 (2024): 422-435.
- Cereda, Emanuele, et al. “Validation of a new prognostic body composition parameter in cancer patients.” Clinical Nutrition (2020).
- Sergi, Giuseppe, et al. “Assessing appendicular skeletal muscle mass with bioelectrical impedance analysis in free-living Caucasian older adults.” Clinical nutrition 34.4 (2015): 667-673.
- Cuz-Jentoft, Alfonso J., et al. “Sarcopenia: revised European consensus on definition and diagnosis.” Age and ageing 48.1 (2019): 16-31.
- Campa, Francesco, et al. "Methods over materials: the need for sport-specific equations to accurately predict fat mass using bioimpedance analysis or anthropometry." Nutrients 15.2 (2023): 278.
- Campa, Francesco, et al. “New bioelectrical impedance vector references and phase angle centile curves in 4,367 adults: The need for an urgent update after 30 years.” Clinical Nutrition 42.9 (2023): 1749-1758.
- Lukaski, Henry C., and Jose Manuel Garcia-Almeida. “Phase angle in applications of bioimpedance in health and disease.” Reviews in Endocrine and Metabolic Disorders 24.3 (2023): 367-370.
- Sardinha, Luís B., et al. “Development and validation of bioelectrical impedance prediction equations estimating regional lean soft tissue mass in middle-aged adults.” European Journal of Clinical Nutrition 77.2 (2023): 202-211.